|
Political parties and socio-economic development of Croatia
February 17, 2008:
Today I read a research article where the authors analyze socio-economic development of Croatian counties:
"Chosen Socio-Demographic Indicators of
the Development of Croatia and Croatian Counties", D.Zivic & N.Pokos, Revija za sociologiju,
Vol 36. (2005), pp.207-224
They use various socio-demographic indicators to evaluate regional socio-economic development of Croatia and rank counties according to these indicators. The used indicators are: index of population change for the period 1991 - 2001, index of ageing, coefficient of total age dependence, general rate of activity of total population, employment rate, unemployment rate and "index of education".
Averaged ranking according to these indicators gives the index of socio-economic development, with smaller indexes representing higher development and vice versa.
Comparison between counties shows large differences in the socio-economic development of Croatia. It is indicative that counties that suffered the most during the 1990's war show the worst trends. It is to be expected that the gap between the most developed and the least developed Croatian regions will be widening, unless something is done to ease these negative trends.
Local county governments and politicians can play a decisive role in the process of regional socio-economic development. Hence, local political life can have a dramatic influence on the counties. Since Croatia recently had parliamentary elections (November 2007), I wondered if there is some correlation between the success of certain political parties and the local index of socio-economic development.
Unfortunately, votes were cast in ten constituencies that do not follow county borders and there are no published election results grouped by counties. Some counties are merged together into a single constituency and some (like the city of Zagreb and Zagreb county) are split between several different constituencies. Therefore I calculated the average index of development for each constituency based on the indexes of individual counties forming the constituency. Then I checked election results for each constituency and created the data table:
data
For the purpose of this mind exercise I grouped political parties into two groups: left/center-left (SDP, HNS, IDS, HSLS/HSS) and right/center-right (HDZ, HDSSB, HSP). Putting on a side the individual description of these political parties, this grouping roughly describes Croatian political spectrum (HSS, for example, belongs to the right, but it has been in a coalition with the left for some time now). Then I plotted the percentage of votes for each of these two groups versus the index of development of the constituency. The result shows a striking correlation between the support to the left/center-left parties and the level of socio-economic development and anti-correlation with the right/center-right.
Of course, this graph alone is not enough for any firm conclusion, especially because the support to parties promoting strong national (or nationalistic) discourse is stronger in regions devastated by the war due to deeper emotional scars on these local communities. A more detailed socio-economic analysis would be prudent. However, one has to wonder what kind of consequences these strong correlations have on the future of the country. Is there a real interest of political pragmatics in the right/center-right parties to actually change the current trends considering that they have a strong support exactly in the least developed regions of Croatia?
Interestingly enough, the new government has been formed by the center-right party (HDZ). The number of seats for each party in the new parliament can be found here:
www.sabor.hr
Update: February 21, 2008
I decided to apply the same analysis to the local county elections in 2005. The analysis is partially incomplete because I have ignored votes to some small political parties or parties that are difficult to classify. The data are available here: data
The final result is in the figure below. Although the data are scattered more than in the previous example of 2007 elections, the trend is still very clear
Update: September 1, 2009
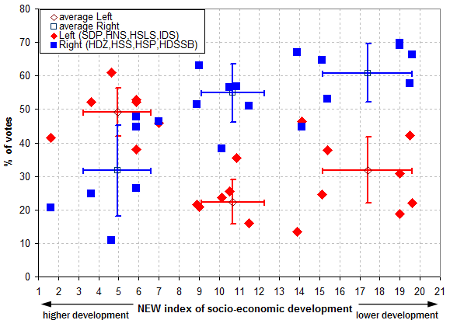
The local county elections of 2009 gave us a new set of data. The procedure is the same as before, except that now we can use one additional ranking of counties according to their local competitiveness index (see www.konkurentnost.hr). I call this the "new index" on my charts shown below.
The data are available here: izbori_2009_data.xls
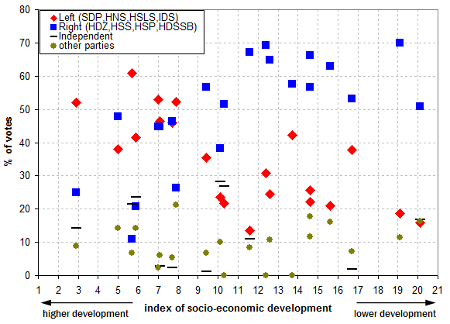 This graph shows results for the left and right parties, together with other smaller parties that I have not included into the analysis (often they have a very regional caracter) and independent candidates.
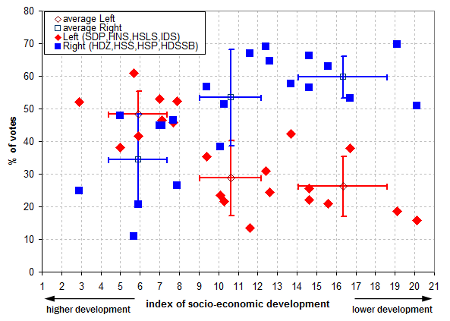
In order to see the overall trends better, I split counties into three groups according to their development index, each group has 7 counties. The results are show below for the index of development that I used in the analysis of previous elections and for the "new" index.
 Copyright Dejan Vinkovic, 2009.
|